Groupon’s Ominous Balance Sheet

In yet another rebuke of Groupon’s (GRPN) accounting methods, Anthony Catanach drew attention to the intangible assets sitting on Groupon’s balance sheet. Whilst he noted the danger of Groupon’s high intangible assets, it is so serious that it warrants a more in-depth analysis.

Intangible assets encompass a wide variety of non-physical assets such as patents and goodwill; however, unlike physical assets, such as cash or equipment, they exist only on paper and so are difficult to value. The valuation of intangibles therefore relies heavily on the estimates and judgment of the company – and Groupon has a less than stellar record in its accounting and reporting.

At first glance, the picture is not too awful – Groupon’s intangible assets account for 15% of it total assets.

(click to enlarge)

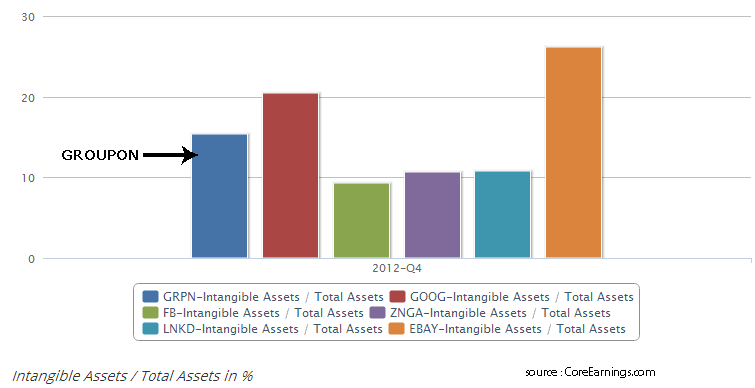
As shown above, Groupon’s proportion of intangible assets appears roughly inline with its peers. Google (GOOG) and eBay (EBAY) both have higher percentages of intangibles (at 20% and 26%, respectively) whilst Linked In (LNKD) and Zynga (ZNGA) are both lower at just over 10%.

Things begin to get scary when reviewing what the intangible assets comprise. Google has a pile of online-pharmacy.org valuable patents (many from its Motorola acquisition) and eBay has some prime acquisitions such as GSI Commerce. Groupon’s intangible assets, by contrast, are far less compelling.

The largest chunk of Groupon’s intangibles is Goodwill, which accounts for $207 million of the $310 million total. Goodwill is created when another company is purchased (technically it is the excess of the amount paid for the company above its net asset value). However, Goodwill can only continue to be carried on the balance sheet so long as its value is not substantially impaired. If the current value is substantially lower, then it should be written off against profits. This is exactly what happened to HP (HPQ) with the write-down of its Automony purchase. The companies Groupon purchased were primarily in the “daily deals” space, and we need only look at the share price of Groupon and the travails of Living Social to gauge how well daily deals businesses are faring. It is therefore a very reasonable conclusion that the goodwill on Groupon’s balance sheet could be ripe for a write-down.

Next up is deferred tax assets of 85 million. These are strange accounting curiosities, the validity of which is an ongoing debate. But one thing is for sure, a deferred tax asset is only useful if a company will generate substantial profits (in which circumstance the deferred tax asset can offset a future tax charge). Groupon, having failed to generate any profit to date, is a pretty poor candidate for having what amounts to a profits tax credit sitting on its balance sheet.

Finally, “other intangibles: of $43 million. For a tech company this would normally include patents and developed technologies; however, Groupon, with a zero research and development expense, is not a technology company. As such, there are some curious items in here – “subscriber relationships” of $21 million and “developed technology” of $11 million. Given the rapid decline of the daily deals business, the subscriber relationships are unlikely to have a significant value (let alone the value Groupon ascribes to them); the developed technology is equally dubious, given Groupon’s zero R&D.

We have seen what substantial write-downs can do to the profitability of a company like Microsoft (MSFT) or the share price of HP. What, then, a major write-down would do to a struggling company like Groupon, which has yet to turn a profit, its rather ominous.

EBITDA – A Misleading Earnings Measure

This article was originally published on CoreEarnings.com .

What is EBITDA?

EBITDA (Earnings before Interest, Tax, Depreciation and Amortization) is a commonly used earnings metric in financial analysis. The central motivation for using EBITDA is that shows a firm’s earnings from its core business activities and it is more of a cash based metric.

The first thing to note about EBITDA is that it is a ‘pro-forma’ measure in that it is not an earnings measure sanctioned under generally accepted accounting principles (GAAP). Therefore http://getzonedup.com/ EBITDA does not appear on an Income Statement and is instead calculated by the firm (or analysts) and reported separately.

The US accounting standards board (FASB) has a strict definition for calculating EBITDA which is adding back only tax, interest, depreciation and amortization to Net Income as reported on the Income Statement. However, most firms choose to report ‘Adjusted EBITDA’ or ‘Sustainable Earnings’ in their earnings releases. These measures and non-standard and vary from firm to firm making comparisons difficult. Typically, in addition to the standard EBITDA adjustments, these measures will also add back items deemed as ‘non-recurring’ such as asset writedowns.

Myth : EBITDA is Cash Earnings

EBITDA is often used interchangeably with cash flow , however it is definitely not a purely cash measure. Whilst some non-cash items such as depreciation are excluded, the earnings element in EBITDA is still based on the accruals concept and so revenue can be recognised even when the cash has not yet been received. If cash earnings are required for analysis, there is already an item in the standard GAAP accounts  – Cash Flow From Operating Activities that is the cash amount earned from a firm’s core business. EBITDA is thus a strange hybrid of an accruals based and a cash-based earnings measure.

It is also difficult to find a convincing rationale for excluding many ‘non-cash’ items such as depreciation. The motivation for removing depreciation and amortization is that they are non-cash expenses. However this is very misleading, the asset which is being depreciated was originally purchased with cash and excluded as an expense on the basis that the asset can be used over several years and so only a proportion of the cost should be included as an expense each year. In the same way, asset impairments and writedowns are based on previous cash payments.

Myth : EBITDA is Sustainable

A common argument for using measures such as EBITDA is that they exclude one-off charges such as asset writedowns which do not recur. This logic has some merit if a company seldom has such charges but the reality is that ‘one-off’ charges are often frequent occcurances for some companies (such as Hewlett Packard) and are indicative of a core issue with the business (such as the inability to generate organic growth and a poor acquisition policy in the case of HP). Therefore excluding these charges would give a misleading impression of the company.

Why the Popularity of EBITDA?

The main proponents of EBITDA and especially its derivatives such as Adjusted EBITDA are the reporting companies themselves. Using EBITDA measures allows firms to ignore a wide variety of costs and expenses and so flatter the business.

Groupon – A Tech Company With Zero Research and Development

This article was originally published on CoreEarnings.com .

In its offering prospectus Groupon billed itself as a ‘local e-commerce’ company which brings ‘the brick and mortar world of local commerce onto the internet’ which clearly defines it as an online tech business.

It is therefore nothing less than astonishing to see no Research & Development expense on the company’s Income Statement. Other companies in the internet/technology space maintain their R&D expense at a fixed percentage of Revenue. The below chart shows the 2012 Q4  R&D / Revenue ratio for several major internet/tech companies :

Most companies have an R&D / Revenue  ratio of between 0.1 – 0.2, Apple is the outlier with only 2% of Revenue spent on R&D, which is partly due to its huge Revenue allowing it to still spend a large absolute amount on R&D yet keep the percentage low and also it essentially outsources its R&D to suppliers.

In addition to being a large expense for a tech company R&D is also kept at a very consistent percentage of https://hotcanadianpharmacy.com Revenue over time, this is a clue to just how important of an expense R&D is. The below chart of R&D/Revenue over time for some of Groupon’s ‘peers’ shows how consistent the ratio is kept.

It is possible this is simply an issue of attribution and Groupon’s R&D-type expenses are included under another heading such as ‘Selling, general and administrative’ however Groupon’s filing make no mention of research type activities being included in other expense headings.

Capital Expenditure

The first place to look for missing expenses is the Cash Flow Statement to see if it has been capitalized instead of expensed. Capital Expenditure is similar to R&D except that Cap Ex leads directly to the creation of a valuable asset (which can be software) whereas R&D is more general research which has not yet led to the creation of an asset. In terms of accounting, R&D is charged directly against Revenue to arrive at a firm’s profit, whereas Cap Ex is not charged against Revenue and instead creates an asset on the Balance Sheet. 

Thus, it can be advantageous for a company to classify R&D as Cap Ex although this is considered at a minimum an aggressive accounting practice. Groupon’s accounting policy is to treat all of its software development as Cap Ex which is a sound policy consistent with accounting policies of some other internet companies such as Amazon. Nevertheless with all of the software development being charged to R&D it remains a concern that not enough is being expensed on the Income Statement.

Using Cash Flow In Financial Analysis

This article was originally published on CoreEarnings.com 

Financial Reporting is primarily focused on providing a detailed view of a firm’s earnings. The accruals concept is applied to both revenues and expenses so that only income/expenses which are earned or occurred in the period are reflected in the accounts irrespective of payments. For example, a software firm which pre-sold licenses for software which has not  yet been delivered and collected payment would not  recognise the sale in its accounts until the software was fully delivered.

The accruals concept is intended to provide a truer picture of a firms financial performance, however it has the drawback of earnings diverging from the cash generated by the business. The core concept is that earnings will eventually show up as cash flow.

http://www.canadianpharmacy365.net/product/lady-era/

The issue with earnings  measures such as Net Income is that they include items such as depreciation and provisions of bad debts which require estimates and so affords the business a degree of latitude in ‘managing’ its earnings.  Cash Flow is a harder measure which must must backed up by movements in the firm’s cash balances which is straightforward to verify. Thus to aid the understanding of financial performance a Statement of Cash Flows is included in financial reports.

The most important item in the Cash Flow statement is the Cash Flows From Operating Activities which shows the cash generated by the firm’s core business activities.  It is arrived at by starting with Operating Income and adjusting for all non-cash items. In financial analysis, capital expenditure is sometimes deducted from Cash Flow from Operating Activities to arrive at Free Cash Flow. The rationale for deducting capital expenditure is that this is a necessary recurring expense for the firm to generate its income.

There are two other balances in the Cash Flow statement – Cash Flow From Financing Activities is the cash movement associated with the financing of the business so issuance or repayment of loans as well as equity issuance will be shown in this balance. Cash Flow from Investing Activities relates to investments the firm may make in securities as well as investments in fixed assets.


Use of the Cash Flow Statement

For a business or financial analyst the primary use of the Cash Flow Statement is in determining the quality of a firm’s earnings. As noted above, a firm’s earnings should eventually be reflected in the firm’s cash flow. Thus Free Cash Flow (or Cash Flow from Operating Activities) should trend with Operating Income, note from the below chart that Apple’s Free Cash Flow closely tracks its Operating Income:


A prolonged divergence in these series could signal aggressive accounting to artificially boost Income.

Cash Flow Statement Limitations

A common misconception is that cash flow is immune from manipulation since the firm must verify the actual movement in its cash balance with bank statements. However, this is only true for the total movement in cash flow, the Cash Flow From Operating Activities balance can easily be manipulated by misclasifying items which should ordinarily be expensed. For example, WorldCom misclassified operating expenses as capital expenditure, which has the effect of removing the expense from both the Income Statement and the Cash Flow From Operating Activities, instead the amount showed up in the Cash Flow From Investing Activities which is less used by financial analysts.

Finally, note that Cash Flow is not the same as EBITDA (Earnings Before Interest, Tax, Depreciation and Amortization) although financial reports sometimes use the two the interchangeably. EBITDA still use the accruals method to arrive at the earnings figure which is then adjusted for non-cash items such as depreciation and amortization. As such EBITDA is a hybrid between a regular accrual based earnings measure and a cash based measure of earnings.

Correlation – The Need For ‘Stationary’ Data

How correlated are Intel and Google’s stock  prices? The below graph shows the daily close of prices of both from mid 2009 to mid 2011.

GOOG INTL Stock Prices

From first impressions, it certainly looks like the two price series move in tandem and should have a high correlation. Indeed it turns out that correlation coefficient of the two stock price series is 0.88 , indicating a high 88% correlation  between the Google and Intel stock prices.

However, this is totally misleading – in reality the correlation between the two is a mere 36%.

Correlation, in common with most time-series data analysis techniques requires ‘stationary’ data as an input. To be stationary the data must have a constant variance over time and be mean reverting. Stock price data (and many other economic data series) exhibit trending patterns which violates the criteria of stationarity. Transformation to stationary data is quite simple, however, as converting the daily price closes into daily returns will normally be sufficient. The return series of a stock is usually considered as stationary for time series analysis purposes, since it is mean-reverting (as the daily returns oscillate above and below and constant mean) and has a constant variance (the magnitude of the returns above and below the mean will be relatively constant over time despite numerous spikes).

The daily series of returns (ie percentage price changes) for both Google and Intel stocks can be seen below. Not that there is no trend to the series which moves above and below a constant mean – which for daily stock price returns is almost always very close to 0%.

GOOG INTL Stationary Series

The requirement for stationary data in calculating correlation can also be explained intuitively. Imagine you were looking to hedge a long position in Google stock with a short position in Intel, you would want the return on the Google stock to the match the return on the Intel stock. Hence correlating the prices would be irrelevant, in such a scenario you would want to know the correlation between the two sets of returns as this is what you would essentially be attempting to match with the hedge.

 Correcting For Drift And Seasonality

In correlating stock price data, transforming the raw price data to returns is usually considered sufficient, however , to be more rigorous any additional trends could be stripped out of the data. Most models of stock price behaviour include the risk free interest rate plus a required rate of return as a constant drift over time – the argument being that stock investors require this return for holding the stock and over the long term the stock should deliver that return. Thus, the this return could be backed out of the series before calculating correlation. In practice, since we are dealing with daily returns, the long term drift as a minimal impact on the calculation of correlation.

Some economic data series such as durable goods orders exhibit strong effects of seasonality. When raw durable goods orders data is transformed into percentage changes, it is indeed mean reverting with a constant mean. However, the series will still not be stationary due to the strong seasonality effects – orders will be much much higher during the Christmas shopping season and so the percentage changes will always spike at the time resulting in a non constant variance.

Seasonality can be dealt with by cleaning the data series using another series which exhibits the same seasonality. In the case of durable goods orders, the raw CPI index (note: not the percentage change in CPI) would be such as series since the CPI index will typically spike during shopping seasons. Thus the durable goods orders could be divided by the CPI to arrive at a ‘deflated’ durable goods series which could then be made stationary by transforming it into percentage changes between periods.